Global Port Congestion in the First Half of 2026—and What to Expect in 2027
By Youcef Kabli,Portnex
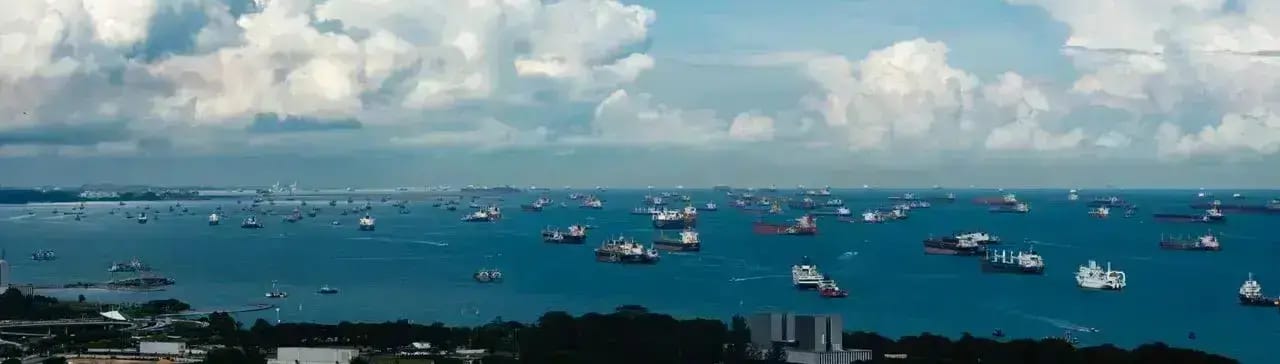
Port congestion in 2027 probably will not resemble the global disruption seen during the pandemic. Instead, we are more likely to see regional disruptions that move through shipping networks. For example, a strike might slow one port, bad weather could affect another, and late vessels may miss their scheduled berths far away.
This pattern was evident in early 2026. Winter weather reduced productivity in Northern Europe, labour action and an oil spill disrupted Antwerp-Bruges, and conflict near the Strait of Hormuz redirected vessels and containers to alternative ports in the UAE and Oman.
Not all major ports faced difficulties. Los Angeles managed its busiest June on record without vessel backlogs. This contrast demonstrates that congestion is not driven by cargo volume alone. Timing, yard capacity, labour, inland transport, and coordination are critical to maintaining efficient port operations.
The 2026 picture at a glance
- Severe winter weather disrupted ports and inland transport across Northern Europe.
- Strikes, pilot action and an oil spill affected an estimated 260,000 TEU at Antwerp-Bruges.
- Conflict around the Strait of Hormuz confined vessels and redirected cargo towards ports in the UAE and Oman.
- Delayed ships began missing berth windows across the Asia–Europe trade corridor.
- Los Angeles processed a record number of TEUs without a backlog, proving that congestion was serious but not universal.
- The most likely 2027 outcome is rolling regional disruption rather than permanent global disruption.
What does port congestion actually mean?
Port congestion occurs when vessels, containers or inland cargo flows exceed a port system’s ability to process them efficiently.
The bottleneck is not always at the berth. It can begin when containers remain in the terminal for too long, railway capacity becomes unavailable, truck queues grow or several delayed vessels arrive together.
Once terminal yards start filling, workers must move more containers to reach the correct boxes. That slows loading and discharge operations, causing vessels to remain at the berth longer and forcing arriving ships to wait.
As a result, congestion can persist even after the initial disruption, such as a storm, strike, or equipment failure, has been resolved.
How is port congestion measured?
There is no single congestion score that tells the entire story. The clearest picture comes from combining vessel, terminal and landside indicators.
The main measures include:
- Vessels at anchor: A sustained increase in ships waiting outside a port can indicate a shortage of available berths.
- Berth waiting time: This measures how long a vessel waits between arriving and securing a berth.
- Vessel turnaround time: The total time from arrival to departure shows whether port calls are taking longer than scheduled.
- Container dwell time: Containers remaining in the yard for extended periods reduce the space available for new cargo.
- Yard occupancy: High terminal density slows and complicates container handling.
- Crane productivity: Falling container moves per crane hour may signal labour, equipment or yard problems.
- Inland delays: Rail cancellations, truck queues and barge waiting times can create congestion even when vessel operations continue.
- Schedule reliability: Repeated late arrivals on the same service often show that delays are spreading through the wider shipping network.
These figures should be evaluated against each port’s typical performance. What is unusual at one terminal may be routine at another, and conditions can differ significantly even within the same port.
What caused port congestion in the first half of 2026?
Four documented developments directly affected port operations and connected trade routes.
Winter weather slowed Northern Europe
Severe winter conditions disrupted operations at Hamburg, Rotterdam, Antwerp, and terminals in northern France in January 2026.
Snow and ice reduced terminal productivity and affected the roads and railways needed to move containers inland. Ships waited at anchor, transport capacity tightened, and carriers considered diverting selected vessels.
Hapag-Lloyd’s operational advisory confirmed that the disruption extended beyond individual ports. Bremerhaven and Wilhelmshaven also faced operational pressure, while longer road and rail journeys reduced inland capacity across the region.
The bottleneck did not always occur at the quay. Terminals could unload ships, but if containers were not moved out efficiently, yards filled up and vessel handling slowed.
Antwerp-Bruges faced three major disruptions
Antwerp-Bruges experienced an unusually difficult sequence of events during the first half of the year.
A four-day strike in the port’s nautical chain in March caused an estimated loss of 100,000 twenty-foot equivalent units, or TEU. An oil spill in the Deurganck dock in April resulted in an estimated additional loss of 85,000 TEU. Pilot action in June disrupted another estimated 75,000 TEU.
Together, these events affected approximately 260,000 TEU of container handling.
The port remained operational and gradually recovered from cargo delays, but first-half container throughput still fell by 1.5% compared with the same period in 2025. The figures were published in the Port of Antwerp-Bruges’ first-half results.
The episode showed how dependent a modern port is on its wider nautical chain. Available cranes and berths are not enough if vessels cannot move safely because pilots, tug services or other essential operations are disrupted.
The Strait of Hormuz crisis redirected Gulf shipping
The most severe maritime disruption of early 2026 developed around the Strait of Hormuz after conflict began on 28 February.
By mid-March, the International Maritime Organization reported that approximately 3,200 vessels were confined west of the strait and around 20,000 seafarers were affected. By 15 June, the IMO had verified at least 46 attacks against international shipping in and around the waterway.
A peace agreement announced in June created a path towards restoring navigation, but the IMO warned that safely releasing vessels and assisting stranded seafarers would take time.
As access became uncertain, cargo shifted towards ports on the UAE’s eastern coast and in Oman. By May, logistics reporting described:
- Higher call volumes and longer waits for some vessels at Fujairah and Khor Fakkan
- Extended waiting times for certain cargo at Jebel Ali
- Container-yard congestion at Sohar, Duqm and Salalah
- Pressure on feeder vessels, trucks and the Oman–UAE land corridor
Rerouting addressed one issue but created new challenges. Ports outside the conflict zone remained operational, yet some struggled to handle the sudden influx of diverted vessels and containers.
Delays spread between Asia and Europe
By late May and June, congestion was increasingly feeding into itself across the Asia–Northern Europe trade corridor.
Weather and capacity problems around Shanghai and Ningbo delayed departures from Asia. When vessels reached Rotterdam or Antwerp behind schedule, they often missed their original berth windows and had to be fitted around other arrivals.
Strong winds, high yard occupancy, feeder delays and inland transport constraints made it harder to recover lost time. Barge waits at Rotterdam and Antwerp reportedly approached four days in some cases, while rail restrictions complicated cargo movements around Hamburg.
June operational reports described a feedback loop where disruption at one end of the route increased congestion at the other.
This cascade effect remains a key risk. A vessel delayed at its first port may arrive late at subsequent stops, disrupting multiple terminals in one rotation.
Was port congestion truly global?
No. Several regions experienced serious congestion, but the first half of 2026 was not a period of universal port gridlock.
Los Angeles offers a useful counterexample. Dockworkers handled 1,002,734 TEU in June, making it the busiest June in the port’s history. During the first six months of the year, Los Angeles processed 5.12 million TEU—3% more than during the same period in 2025.
Despite record volume, the port reported no vessel backlogs or cargo delays. The official June cargo report credited effective coordination among dockworkers, terminal operators, trucking companies, and rail partners.
The key takeaway is not that Los Angeles is immune to congestion, but that high volume only becomes a crisis when arrivals, terminal capacity, and inland transport are not properly balanced.
How did congestion affect freight rates?
Port congestion can increase freight rates by reducing the effective availability of ships and containers.
A vessel waiting several days for a berth cannot complete its next journey on time. Containers trapped at destination terminals are unavailable to exporters elsewhere. Carriers may also burn additional fuel while trying to recover disrupted schedules.
During one week in early June, the Freightos Baltic Index recorded increases of:
- 51% on Asia–US West Coast routes
- 25% on Asia–US East Coast routes
- 37% on Asia–Northern Europe routes
- 24% on Asia–Mediterranean routes
Congestion was only part of the explanation. Earlier peak-season demand, rising fuel costs, Red Sea diversions and companies advancing shipments also influenced the market. Freightos’ June analysis provides the wider context.
Freight prices should not be viewed as a stand-alone measure of congestion. They reflect demand, capacity, fuel costs, risk, carrier pricing decisions, and conditions at individual ports.
How did ports respond?
The most effective responses focused on practical capacity and better coordination.
Singapore prepared for volatile arrivals by bringing four additional Tuas Port berths into operation during 2026. Its digitalPort@SG platform was also used to coordinate vessel arrival times and reduce the risk of several delayed ships arriving together. Port operations remained stable despite disruption elsewhere.
Rotterdam encouraged more evening and overnight container movements to reduce pressure on terminals and surrounding roads. Gulf supply chains made greater use of Omani ports and the Oman–UAE Green Corridor. Carriers also adjusted port rotations and sailing schedules.
While these measures did not eliminate congestion, they provided flexibility to respond before a local bottleneck escalated into a broader operational failure.
What is the port congestion outlook for 2027?
The base case anticipates ongoing regional disruptions rather than sustained global gridlock.
Weather, labour actions, high yard occupancy, and inland transport issues are likely to cause short-term regional bottlenecks. Most will be manageable, though some may spread if delayed vessels miss berth windows at other ports.
Three broad scenarios capture the range of possible outcomes.
Base case: recurring regional bottlenecks
Under the most likely scenario, congestion appears in individual regions for days or weeks before easing.
Northern European ports remain vulnerable to rail, road and barge constraints. Asian hubs face vessel bunching during seasonal peaks, while Gulf ports remain exposed to security developments around Hormuz.
Shipping schedules may remain uneven, but the network is expected to avoid a prolonged global breakdown.
Better case: capacity and coordination reduce delays
New berths, improved arrival planning and more reliable inland transport allow ports to absorb disrupted schedules more effectively.
Major transshipment hubs benefit from additional capacity, while shipping lines use better arrival data to avoid sending several vessels into the same terminal window.
These improvements would not eliminate congestion but would reduce recovery times.
High-risk case: another chokepoint disruption
A renewed closure or serious security incident at Hormuz, the Red Sea or another major maritime chokepoint would produce the most disruptive outcome.
Longer routes would absorb vessel capacity, alternative ports would receive more cargo, and late ships would increase pressure in Asia and Europe. Freight costs could rise sharply, even at fully operational ports.
The Hormuz crisis demonstrated that reopening a waterway does not immediately restore normal traffic. Insurance restrictions, safety assessments, and shipowner and crew confidence can delay recovery well after an agreement is reached.
What should businesses monitor?
The most useful warning signs are practical rather than dramatic:
- Rising vessel queues at major gateways
- Berth waiting times moving above their normal range
- Increasing container dwell and terminal-yard occupancy
- Repeated barge, rail or truck delays
- Falling schedule reliability on key services
- Security notices affecting Hormuz or the Red Sea
- Announced pilot, dockworker or railway industrial action
Businesses should identify alternative ports and inland routes before disruptions occur. This analysis should consider customs requirements, available road and rail capacity, additional transit time, and the likelihood that competitors may select the same alternatives.
For critical goods, consider increasing inventory or placing orders earlier. Shipping contracts should address free time, demurrage, detention, and congestion surcharges before delays occur.
Final assessment
Port congestion will continue to pose a significant supply chain risk in 2027, but it is unlikely to impact all regions simultaneously.
The more likely threat is dynamic. A storm, strike, security incident, or railway failure disrupts one region, causing vessel delays or rerouting, which then creates pressure at subsequent ports.
The first half of 2026 demonstrated that resilience requires more than cranes and berths. Ports also need sufficient staffing, reliable pilot services, manageable yards, dependable inland transport, and accurate information on incoming vessels.
For shippers, the practical question is not whether every port will become congested. It is where the next bottleneck will form, how quickly it will spread, and whether an alternative route will still have capacity when needed.
Methodology and sources
This analysis covers documented maritime and port events between 1 January and 30 June 2026. Events were included when supported by port authorities, the International Maritime Organization, shipping lines, government sources or established logistics reporting.
The 2027 sections are scenario-based forecasts derived from those events. They represent an informed assessment, not confirmed future conditions.